▼
Advanced Options
?
Sort by:


popularity
similarity
?
Must Include:
?
Cannot Include:
?
Look For
▼
Sponsored Links
You're looking for other sites like :
 |
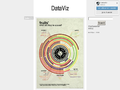
By country and continent, 1999-2009. From the OECD, June 2009. A word tree centered on "we" ... Economic Recession. Let's hope it's over soon. Sports. All ...
http://manyeyes.alphaworks.ibm.com/manyeyes/
popularity:
visualization
data
tools
statistics
web2.0
graphics
research
visualisation
design
software
|
new
search by a custom tag signature
|
|
Offers a series of interactive web projects.
similarity:
popularity:
visualization
art
design
data
information
research
programming
software
technology
processing
|
|
|
Tired of red/yellow/green or up/down arrows for indicators? ... in Real Time | VizWorld.com: [...] National Debt Clock : Real Time via ChartPorn. ...
similarity:
popularity:
visualization
infographics
design
charts
data
blog
graphics
maps
statistics
blogs
|
 |
DataViz. one of several mediaeater visual streams. Archive / RSS. July 10. July 9. July 7. Next " ...
similarity:
popularity:
visualization
infographics
design
data
statistics
information
blog
graphic
graphics
visualisation
|
|
|
UUorld (pronounced "world") provides an immersive mapping environment, high ... Great explanations are unfortunately scarce, but UUorld makes them easier to ...
similarity:
popularity:
visualization
maps
statistics
software
mapping
tools
data
gis
geography
world
|
 |
Permalink | 1643Commentshttp://simplecomplexity.net/uncategorized/new-design/NOTE%3A ... Permalink | 1649Commentshttp://simplecomplexity.net/visualization/where ...
similarity:
popularity:
visualization
infographics
design
blog
data
information
statistics
maps
graphics
inspiration
|
 |
Use Gephi to explore, analyse, spatialise, filter, cluterize, ... Gephi.org © All Rights Reserved 2008-2009. home about sitemap links ...
similarity:
popularity:
visualization
graph
software
opensource
tools
network
data
maps
3d
graphics
|
|
|
The Fidg't Visualizer allows you to play around with your network. ... Once a Tag Magnet is created, members of the network will gravitate towards it ...
similarity:
popularity:
visualization
social
flickr
design
software
networks
socialnetworks
network
data
web2.0
|
|
|
Providing a broader (and deeper) view of Digg through a host of Flash visualization tools.
similarity:
popularity:
visualization
digg
web2.0
design
labs
flash
news
information
tools
data
|
 |
Prezi is the zooming presentation editor ... Why should you move beyond slides? Adam Somlai-Fischer on 24 February 2010. James Geary's famous talk from TED ...
similarity:
popularity:
presentation
tools
web2.0
presentations
powerpoint
visualization
software
tool
design
slideshow
|
|
|
No information avaiable
similarity:
popularity:
google
data
statistics
visualization
charts
reference
tools
research
datasets
economics
|
Sorting Results
- This slider determines how the matched sites are sorted.
- If you want to see the most popular sites that are somewhat related to your search, slide this more towards "popularity."
- If you want to see the sites that best matched your search, regardless of popularity, slide this towards "similarity."
Must Include Tags
- Matched sites will not be shown unless they have all of the tags on this list.
- This feature is useful for when you require a site to have been tagged as something.
- To add a tag to this list, click "add tag" or click on any tag in a result.
Must Not Include Tags
- Matched sites that have any tag on this list will not be shown.
- This feature is useful for filtering out results that have tags you are absolutely not interested in.
- To add a tag to this list, click "add tag" or click on any tag in a result.
Types of Results
- This option lets you specify the types of sites to show.
- If you want to only see domains (www.
.com), select "domains only." - If you want to only see articles (www.
.com/something/here), select "articles only." - If you don't care, or care so much about both, select "Both".
About The Results
 an example search result
How moreofit Searches
Each website has a unique tag signature -- a set of words
that users have described the website as. Moreofit searches
for websites that have similar tag signatures and displays the results.
1: Similarity
A site's "similarity" is determined by how well its tag signature matches the tag
signature that is being searched for. A 100% match means that it has the exact same
tags in the exact same order, while a 0% match means it has no tags in common.
2: Popularity
The popularity of a website is, well, pretty much self explanatory.
3: Tag Signature
The tag signatures show how a site is described. The deeper the color of the tag,
the more frequently the website is tagged as this. Tags underlined blue denote a tag
that is in common with the search's tag signature.