▼
Advanced Options
?
Sort by:


popularity
similarity
?
Must Include:
?
Cannot Include:
?
Look For
▼
Sponsored Links
You're looking for other sites like :
|
|
No information avaiable
http://www.google.com/publicdata/directory
popularity:
google
data
statistics
visualization
charts
reference
tools
research
datasets
economics
|
new
search by a custom tag signature
|
|
Students, journalists, policy makers and everyone else can play with ... Embedded charts and links can update automatically so you're always sharing the ...
similarity:
popularity:
google
data
visualization
statistics
analytics
reference
information
research
public
tools
|
 |
Gapminder promotes a fact based world view by unveiling the beauty of statistics. ... subscribe. Sign up for updates on new tools and features from Gapminder. ...
similarity:
popularity:
statistics
visualization
data
economics
information
development
politics
world
tools
reference
|
 |
Swivel is a place where curious people explore all kinds of statistical data from around the world.
similarity:
popularity:
data
statistics
visualization
web2.0
tools
graphs
analysis
charts
web
analytics
|
|
|
No information avaiable
similarity:
popularity:
visualization
google
statistics
data
charts
tools
graph
analysis
gapminder
web2.0
|
 |
Please enable JavaScript to use Data360.org. Please follow the steps below to enable JavaScript. First determine what browser version is in use: ...
similarity:
popularity:
data
visualization
statistics
web2.0
research
reference
graphics
graph
social
tools
|
 |
List of Roots ... Sign up Home About Help Blog Gallery. Infochimps.org is still in beta testing. ... Find any dataset in the world at Infochimps.org ...
similarity:
popularity:
data
statistics
datasets
database
research
datamining
repository
reference
visualization
free
|
 |
By country and continent, 1999-2009. From the OECD, June 2009. A word tree centered on "we" ... Economic Recession. Let's hope it's over soon. Sports. All ...
similarity:
popularity:
visualization
data
tools
statistics
web2.0
graphics
research
visualisation
design
software
|
|
|
No information avaiable
similarity:
popularity:
google
statistics
internet
trends
stats
research
data
demographics
tools
technology
|
|
|
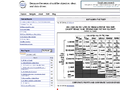
In several columns of a spreadsheet, add the data (including column headings) ... You'll need to create columns for the main data point, the time period (Motion ...
similarity:
popularity:
google
charts
statistics
data
visualization
motion
chart
tools
design
googledocs
|
 |
Timetric makes data useful by storing, searching, graphing and publishing the world's statistical data
similarity:
popularity:
visualization
statistics
data
tools
charts
graph
api
timeseries
analytics
web
|
Sorting Results
- This slider determines how the matched sites are sorted.
- If you want to see the most popular sites that are somewhat related to your search, slide this more towards "popularity."
- If you want to see the sites that best matched your search, regardless of popularity, slide this towards "similarity."
Must Include Tags
- Matched sites will not be shown unless they have all of the tags on this list.
- This feature is useful for when you require a site to have been tagged as something.
- To add a tag to this list, click "add tag" or click on any tag in a result.
Must Not Include Tags
- Matched sites that have any tag on this list will not be shown.
- This feature is useful for filtering out results that have tags you are absolutely not interested in.
- To add a tag to this list, click "add tag" or click on any tag in a result.
Types of Results
- This option lets you specify the types of sites to show.
- If you want to only see domains (www.
.com), select "domains only." - If you want to only see articles (www.
.com/something/here), select "articles only." - If you don't care, or care so much about both, select "Both".
About The Results
 an example search result
How moreofit Searches
Each website has a unique tag signature -- a set of words
that users have described the website as. Moreofit searches
for websites that have similar tag signatures and displays the results.
1: Similarity
A site's "similarity" is determined by how well its tag signature matches the tag
signature that is being searched for. A 100% match means that it has the exact same
tags in the exact same order, while a 0% match means it has no tags in common.
2: Popularity
The popularity of a website is, well, pretty much self explanatory.
3: Tag Signature
The tag signatures show how a site is described. The deeper the color of the tag,
the more frequently the website is tagged as this. Tags underlined blue denote a tag
that is in common with the search's tag signature.