▼
Advanced Options
?
Sort by:


popularity
similarity
?
Must Include:
?
Cannot Include:
?
Look For
▼
Sponsored Links
You're looking for other sites like :
 |
No information avaiable
http://stats.oecd.org/OECDregionalstatistics/
popularity:
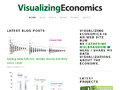
visualization
statistics
oecd
maps
economics
data
flash
reference
tools
graphic
|
new
search by a custom tag signature
 |
Gapminder promotes a fact based world view by unveiling the beauty of statistics. ... subscribe. Sign up for updates on new tools and features from Gapminder. ...
similarity:
popularity:
statistics
visualization
data
economics
information
development
politics
world
tools
reference
|
 |
No information avaiable
similarity:
popularity:
statistics
visualization
data
economics
world
maps
politics
research
history
flash
|
 |
No information avaiable
similarity:
popularity:
economics
visualization
data
statistics
graphics
information
maps
blog
education
reference
|
|
|
No information avaiable
similarity:
popularity:
data
economics
statistics
imf
visualization
maps
database
graphics
flash
world
|
 |
A collection of world maps, where territories are re-sized on according to the subject of interest. ... bit more about Worldmapper ... Use 'Map Categories' or ' ...
similarity:
popularity:
maps
statistics
visualization
geography
world
reference
map
politics
research
tools
|
|
|
UUorld (pronounced "world") provides an immersive mapping environment, high ... Great explanations are unfortunately scarce, but UUorld makes them easier to ...
similarity:
popularity:
visualization
maps
statistics
software
mapping
tools
data
gis
geography
world
|
 |
Swivel is a place where curious people explore all kinds of statistical data from around the world.
similarity:
popularity:
data
statistics
visualization
web2.0
tools
graphs
analysis
charts
web
analytics
|
|
|
Artist David Bleja displays the globe's CO2 emission rates alongside each country's birth and death rates -- all in real-time.
similarity:
popularity:
environment
statistics
visualization
maps
earth
pollution
flash
reference
science
map
|
 |
Please enable JavaScript to use Data360.org. Please follow the steps below to enable JavaScript. First determine what browser version is in use: ...
similarity:
popularity:
data
visualization
statistics
web2.0
research
reference
graphics
graph
social
tools
|
 |
By country and continent, 1999-2009. From the OECD, June 2009. A word tree centered on "we" ... Economic Recession. Let's hope it's over soon. Sports. All ...
similarity:
popularity:
visualization
data
tools
statistics
web2.0
graphics
research
visualisation
design
software
|
Sorting Results
- This slider determines how the matched sites are sorted.
- If you want to see the most popular sites that are somewhat related to your search, slide this more towards "popularity."
- If you want to see the sites that best matched your search, regardless of popularity, slide this towards "similarity."
Must Include Tags
- Matched sites will not be shown unless they have all of the tags on this list.
- This feature is useful for when you require a site to have been tagged as something.
- To add a tag to this list, click "add tag" or click on any tag in a result.
Must Not Include Tags
- Matched sites that have any tag on this list will not be shown.
- This feature is useful for filtering out results that have tags you are absolutely not interested in.
- To add a tag to this list, click "add tag" or click on any tag in a result.
Types of Results
- This option lets you specify the types of sites to show.
- If you want to only see domains (www.
.com), select "domains only." - If you want to only see articles (www.
.com/something/here), select "articles only." - If you don't care, or care so much about both, select "Both".
About The Results
 an example search result
How moreofit Searches
Each website has a unique tag signature -- a set of words
that users have described the website as. Moreofit searches
for websites that have similar tag signatures and displays the results.
1: Similarity
A site's "similarity" is determined by how well its tag signature matches the tag
signature that is being searched for. A 100% match means that it has the exact same
tags in the exact same order, while a 0% match means it has no tags in common.
2: Popularity
The popularity of a website is, well, pretty much self explanatory.
3: Tag Signature
The tag signatures show how a site is described. The deeper the color of the tag,
the more frequently the website is tagged as this. Tags underlined blue denote a tag
that is in common with the search's tag signature.