▼
Advanced Options
?
Sort by:


popularity
similarity
?
Must Include:
?
Cannot Include:
?
Look For
▼
Sponsored Links
You're looking for other sites like :
|
|
No information avaiable
http://scidavis.sourceforge.net/index.html
popularity:
visualization
software
science
python
opensource
plot
data
graphics
linux
statistics
|
new
search by a custom tag signature
 |
No information avaiable
similarity:
popularity:
visualization
graph
software
tools
graphviz
data
graphics
opensource
charts
programming
|
 |
Prefuse is a set of software tools for creating rich interactive data visualizations. ... 2006.05.18: The prefuse.org website has moved to a new server, with better ...
similarity:
popularity:
visualization
java
graph
opensource
programming
software
library
graphics
tools
design
|
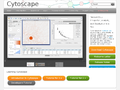 |
Cytoscape is an open source bioinformatics software platform for visualizing ... Get Started with the expanded Cytoscape online tutorials. ...
similarity:
popularity:
visualization
bioinformatics
software
graph
opensource
java
tools
networks
science
network
|
 |
Developers of a data analysis tool and visual spreadsheet for databases.
similarity:
popularity:
visualization
software
analytics
data
analysis
tools
database
datamining
statistics
bi
|
|
|
Open project created through the MIT Media Lab.
similarity:
popularity:
programming
visualization
software
processing
design
graphics
art
opensource
java
animation
|
|
|
Within SciPy are modules for graphics and plotting, ... together with other subdomains of the scipy.org domain, serves as a portal for all ...
similarity:
popularity:
python
programming
science
math
software
library
tools
opensource
statistics
scipy
|
 |
Feb 11, 2011 to Miscellaneous | Post on Twitter. I got a chuckle out ... Feb 10, 2011 to Miscellaneous Visualization | Post on Twitter. As we all know, the iPad ...
similarity:
popularity:
visualization
data
statistics
infographics
design
blog
graphics
tools
web2.0
visualisation
|
|
|
No information avaiable
similarity:
popularity:
python
graphics
visualization
programming
software
art
design
opensource
nodebox
interface
|
|
|
matplotlib is a finalist for the sourceforge community choice award "best ... Download matplotlib from the sourceforge project page (but first take a look at ...
similarity:
popularity:
python
visualization
graphics
programming
plotting
math
matlab
software
library
graph
|
 |
No information avaiable
similarity:
popularity:
visualization
statistics
java
software
graphics
datamining
tools
data
graph
programming
|
Sorting Results
- This slider determines how the matched sites are sorted.
- If you want to see the most popular sites that are somewhat related to your search, slide this more towards "popularity."
- If you want to see the sites that best matched your search, regardless of popularity, slide this towards "similarity."
Must Include Tags
- Matched sites will not be shown unless they have all of the tags on this list.
- This feature is useful for when you require a site to have been tagged as something.
- To add a tag to this list, click "add tag" or click on any tag in a result.
Must Not Include Tags
- Matched sites that have any tag on this list will not be shown.
- This feature is useful for filtering out results that have tags you are absolutely not interested in.
- To add a tag to this list, click "add tag" or click on any tag in a result.
Types of Results
- This option lets you specify the types of sites to show.
- If you want to only see domains (www.
.com), select "domains only." - If you want to only see articles (www.
.com/something/here), select "articles only." - If you don't care, or care so much about both, select "Both".
About The Results
 an example search result
How moreofit Searches
Each website has a unique tag signature -- a set of words
that users have described the website as. Moreofit searches
for websites that have similar tag signatures and displays the results.
1: Similarity
A site's "similarity" is determined by how well its tag signature matches the tag
signature that is being searched for. A 100% match means that it has the exact same
tags in the exact same order, while a 0% match means it has no tags in common.
2: Popularity
The popularity of a website is, well, pretty much self explanatory.
3: Tag Signature
The tag signatures show how a site is described. The deeper the color of the tag,
the more frequently the website is tagged as this. Tags underlined blue denote a tag
that is in common with the search's tag signature.