▼
Advanced Options
?
Sort by:


popularity
similarity
?
Must Include:
?
Cannot Include:
?
Look For
▼
Sponsored Links
You're looking for other sites like :
|
|
NodeXL is a powerful and easy-to-use interactive network visualisation and analysis tool that leverages the widely available MS Excel application as the platform for ...
http://research.microsoft.com/en-us/projects/nodexl/
popularity:
visualization
excel
network
social
free
microsoft
graph
datamining
statistics
analysis
|
new
search by a custom tag signature
|
|
We suggest that this type of complex layered graph is effective for displaying ... We provide a mathematical analysis of how this layered graph relates to ...
similarity:
popularity:
visualization
statistics
design
streamgraph
graphics
data
graph
paper
charts
research
|
|
|
No information avaiable
similarity:
popularity:
statistics
r
network
software
visualization
sna
analysis
social
research
networks
|
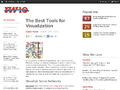 |
Visualization is a technique to graphically represent sets of data. ... TrackBack URL for this entry: http://www.readwriteweb.com/cgi-bin/mt/mt-tb.cgi/3527 ...
similarity:
popularity:
visualization
tools
web2.0
design
graphics
internet
social
web
data
visualisation
|
 |
Swivel is a place where curious people explore all kinds of statistical data from around the world.
similarity:
popularity:
data
statistics
visualization
web2.0
tools
graphs
analysis
charts
web
analytics
|
 |
so_many_a_second is a visualizer that shows mondial statistics on a human scale. ... The great artworks of Chris Jordan have been an initial inspiration ...
similarity:
popularity:
visualization
statistics
design
information
flash
social
visualisation
data
inspiration
world
|
|
|
theinfo.org. for people with large data sets [log in] [edit] [history] ... theinfo.org is a community site; if you want to help run it, join the mailing list. ...
similarity:
popularity:
data
visualization
datasets
programming
dataset
analysis
web
statistics
datamining
database
|
|
|
No information avaiable
similarity:
popularity:
visualization
graph
rdf
semanticweb
tools
data
graphs
statistics
network
charts
|
|
|
Among other things, this ensures we have early access to upcoming software ... The Gold level now has a requirement for completion of an independently run ...
similarity:
popularity:
visualization
excel
blog
design
dashboard
data
charts
statistics
dashboards
software
|
|
|
Collaborative undertaking to promote greater cooperation in the engineering and maintenance of a robust, scalable global Internet infrastructure.
similarity:
popularity:
internet
analysis
network
visualization
research
tools
traffic
statistics
networking
data
|
|
|
No information avaiable
similarity:
popularity:
excel
charts
visualization
blog
tips
tutorials
graphics
reference
howto
office
|
Sorting Results
- This slider determines how the matched sites are sorted.
- If you want to see the most popular sites that are somewhat related to your search, slide this more towards "popularity."
- If you want to see the sites that best matched your search, regardless of popularity, slide this towards "similarity."
Must Include Tags
- Matched sites will not be shown unless they have all of the tags on this list.
- This feature is useful for when you require a site to have been tagged as something.
- To add a tag to this list, click "add tag" or click on any tag in a result.
Must Not Include Tags
- Matched sites that have any tag on this list will not be shown.
- This feature is useful for filtering out results that have tags you are absolutely not interested in.
- To add a tag to this list, click "add tag" or click on any tag in a result.
Types of Results
- This option lets you specify the types of sites to show.
- If you want to only see domains (www.
.com), select "domains only." - If you want to only see articles (www.
.com/something/here), select "articles only." - If you don't care, or care so much about both, select "Both".
About The Results
 an example search result
How moreofit Searches
Each website has a unique tag signature -- a set of words
that users have described the website as. Moreofit searches
for websites that have similar tag signatures and displays the results.
1: Similarity
A site's "similarity" is determined by how well its tag signature matches the tag
signature that is being searched for. A 100% match means that it has the exact same
tags in the exact same order, while a 0% match means it has no tags in common.
2: Popularity
The popularity of a website is, well, pretty much self explanatory.
3: Tag Signature
The tag signatures show how a site is described. The deeper the color of the tag,
the more frequently the website is tagged as this. Tags underlined blue denote a tag
that is in common with the search's tag signature.