▼
Advanced Options
?
Sort by:


popularity
similarity
?
Must Include:
?
Cannot Include:
?
Look For
▼
Sponsored Links
You're looking for other sites like :
 |
No information avaiable
http://rosuda.org/mondrian/
popularity:
visualization
statistics
java
software
graphics
datamining
tools
data
graph
programming
|
new
search by a custom tag signature
 |
Blog assessing and criticizing unclear, uninformative graphics of data, and recycling "chartjunk" as junk art.
similarity:
popularity:
visualization
statistics
charts
design
blog
graphics
information
blogs
infographics
data
|
|
|
R, also called GNU S, is a strongly functional language and environment to statistically explore data sets, make many graphical displays of data from custom command ...
similarity:
popularity:
statistics
software
r
programming
opensource
math
tools
visualization
mathematics
science
|
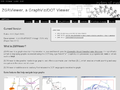 |
2009-07-05: New in SVN/0.9.0-SNAPSHOT. 2009-05-19: ZVTM and ZGRViewer to be ... ZGRViewer is a 2.5D graph visualizer implemented in Java and based upon the ...
similarity:
popularity:
visualization
graphviz
java
graph
software
dot
graphics
graphs
tools
opensource
|
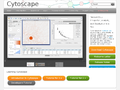 |
Cytoscape is an open source bioinformatics software platform for visualizing ... Get Started with the expanded Cytoscape online tutorials. ...
similarity:
popularity:
visualization
bioinformatics
software
graph
opensource
java
tools
networks
science
network
|
|
|
Open project created through the MIT Media Lab.
similarity:
popularity:
programming
visualization
software
processing
design
graphics
art
opensource
java
animation
|
|
|
Our free weekly newsletter showcases all of ACM Queue's latest articles and ... Stay up to date on the latest developments at ACM Queue, including announcements ...
similarity:
popularity:
visualization
data
design
infographics
graphics
statistics
charts
reference
information
graph
|
 |
General framework for the modeling, analysis, and ... Projects Using JUNG. FAQ. Support. Team. Presentations. Bug Tracker. Sourceforge. Acknowledgements ...
similarity:
popularity:
java
graph
visualization
library
programming
network
opensource
graphs
software
framework
|
 |
Timetric makes data useful by storing, searching, graphing and publishing the world's statistical data
similarity:
popularity:
visualization
statistics
data
tools
charts
graph
api
timeseries
analytics
web
|
 |
Implements a very innovative system for sub-graphing and allows for ... source libraries that are hosted on SourceForge can be found in the NetworkViz Project. ...
similarity:
popularity:
java
graph
visualization
library
software
framework
opensource
network
programming
graphics
|
|
|
The Rise of the Data Web. The Three Sexy Skills of Data Geeks. Dataviz ... People who love scatter plots & connecting dots. How Google and Facebook are using R ...
similarity:
popularity:
statistics
visualization
data
analytics
datamining
programming
career
geek
business
education
|
Sorting Results
- This slider determines how the matched sites are sorted.
- If you want to see the most popular sites that are somewhat related to your search, slide this more towards "popularity."
- If you want to see the sites that best matched your search, regardless of popularity, slide this towards "similarity."
Must Include Tags
- Matched sites will not be shown unless they have all of the tags on this list.
- This feature is useful for when you require a site to have been tagged as something.
- To add a tag to this list, click "add tag" or click on any tag in a result.
Must Not Include Tags
- Matched sites that have any tag on this list will not be shown.
- This feature is useful for filtering out results that have tags you are absolutely not interested in.
- To add a tag to this list, click "add tag" or click on any tag in a result.
Types of Results
- This option lets you specify the types of sites to show.
- If you want to only see domains (www.
.com), select "domains only." - If you want to only see articles (www.
.com/something/here), select "articles only." - If you don't care, or care so much about both, select "Both".
About The Results
 an example search result
How moreofit Searches
Each website has a unique tag signature -- a set of words
that users have described the website as. Moreofit searches
for websites that have similar tag signatures and displays the results.
1: Similarity
A site's "similarity" is determined by how well its tag signature matches the tag
signature that is being searched for. A 100% match means that it has the exact same
tags in the exact same order, while a 0% match means it has no tags in common.
2: Popularity
The popularity of a website is, well, pretty much self explanatory.
3: Tag Signature
The tag signatures show how a site is described. The deeper the color of the tag,
the more frequently the website is tagged as this. Tags underlined blue denote a tag
that is in common with the search's tag signature.