▼
Advanced Options
?
Sort by:


popularity
similarity
?
Must Include:
?
Cannot Include:
?
Look For
▼
Sponsored Links
You're looking for other sites like :
|
|
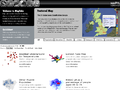
You can drag each section left or right to see milestones of different time periods. ... Web document, http://www.datavis.ca/milestones/. Accessed: Copyright © 2001-2009 Michael ...
http://datavis.ca/milestones/
popularity:
visualization
history
data
maps
cartography
timeline
mapping
graphics
statistics
infographics
|
new
search by a custom tag signature
|
|
Data visualizations can be gorgeous, but images often don't do them justice, especially if we're talking live, real-time visualizations (some of which require a
similarity:
popularity:
visualization
data
video
statistics
graphics
visualisation
inspiration
visualizations
technology
visual
|
 |
This map shows MPs' expenses for April 2007 to March 2008 taken from the data ... This is a map showing data from an online survey of people's reaction to the ...
similarity:
popularity:
maps
visualization
mashup
mapping
web2.0
geography
map
data
tools
statistics
|
|
|
No information avaiable
similarity:
popularity:
maps
infographics
visualization
statistics
data
geography
economics
world
fun
information
|
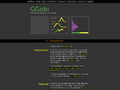 |
GGobi is a data visualization system for viewing high-dimensional data and is ... Learn how to use GGobi with the manual, the book, and the demo movies ...
similarity:
popularity:
visualization
statistics
software
graphics
data
r
opensource
datamining
tools
analysis
|
 |
No information avaiable
similarity:
popularity:
economics
visualization
data
statistics
graphics
information
maps
blog
education
reference
|
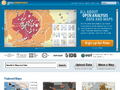 |
GeoCommons delivers visual analytics through maps. ... The technology platform that powers GeoCommons is now available as an enterprise ...
similarity:
popularity:
maps
visualization
mashup
gis
data
web2.0
tools
map
mapping
googlemaps
|
 |
I agree to the GeoCommons Terms of Use. Submit. or... Sign in with your account ... Maker! was designed by cartographers with an eye for detail. ... Maker! ...
similarity:
popularity:
maps
visualization
mapping
tools
data
web2.0
mashup
map
gis
geography
|
 |
Gapminder promotes a fact based world view by unveiling the beauty of statistics. ... subscribe. Sign up for updates on new tools and features from Gapminder. ...
similarity:
popularity:
statistics
visualization
data
economics
information
development
politics
world
tools
reference
|
|
|
No information avaiable
similarity:
popularity:
visualization
statistics
infographics
culture
data
nytimes
interactive
time
demographics
flash
|
|
|
No information avaiable
similarity:
popularity:
visualization
mapping
maps
cities
urban
history
geography
research
web2.0
storytelling
|
Sorting Results
- This slider determines how the matched sites are sorted.
- If you want to see the most popular sites that are somewhat related to your search, slide this more towards "popularity."
- If you want to see the sites that best matched your search, regardless of popularity, slide this towards "similarity."
Must Include Tags
- Matched sites will not be shown unless they have all of the tags on this list.
- This feature is useful for when you require a site to have been tagged as something.
- To add a tag to this list, click "add tag" or click on any tag in a result.
Must Not Include Tags
- Matched sites that have any tag on this list will not be shown.
- This feature is useful for filtering out results that have tags you are absolutely not interested in.
- To add a tag to this list, click "add tag" or click on any tag in a result.
Types of Results
- This option lets you specify the types of sites to show.
- If you want to only see domains (www.
.com), select "domains only." - If you want to only see articles (www.
.com/something/here), select "articles only." - If you don't care, or care so much about both, select "Both".
About The Results
 an example search result
How moreofit Searches
Each website has a unique tag signature -- a set of words
that users have described the website as. Moreofit searches
for websites that have similar tag signatures and displays the results.
1: Similarity
A site's "similarity" is determined by how well its tag signature matches the tag
signature that is being searched for. A 100% match means that it has the exact same
tags in the exact same order, while a 0% match means it has no tags in common.
2: Popularity
The popularity of a website is, well, pretty much self explanatory.
3: Tag Signature
The tag signatures show how a site is described. The deeper the color of the tag,
the more frequently the website is tagged as this. Tags underlined blue denote a tag
that is in common with the search's tag signature.