▼
Advanced Options
?
Sort by:


popularity
similarity
?
Must Include:
?
Cannot Include:
?
Look For
▼
Sponsored Links
You're looking for other sites like :
 |
By country and continent, 1999-2009. From the OECD, June 2009. A word tree centered on "we" ... Economic Recession. Let's hope it's over soon. Sports. All ...
http://manyeyes.alphaworks.ibm.com/manyeyes/
popularity:
visualization
data
tools
statistics
web2.0
graphics
research
visualisation
design
software
|
new
search by a custom tag signature
 |
Gapminder promotes a fact based world view by unveiling the beauty of statistics. ... subscribe. Sign up for updates on new tools and features from Gapminder. ...
similarity:
popularity:
statistics
visualization
data
economics
information
development
politics
world
tools
reference
|
|
|
We suggest that this type of complex layered graph is effective for displaying ... We provide a mathematical analysis of how this layered graph relates to ...
similarity:
popularity:
visualization
statistics
design
streamgraph
graphics
data
graph
paper
charts
research
|
|
|
Create powerful visualizations of charts and graphs from a variety of sources, and easily share your widgenie with the world.
similarity:
popularity:
visualization
widgets
tools
web2.0
data
charts
widget
statistics
webdesign
graphs
|
 |
Help messages will display here, please drag a shape from left palette to get started ... Upload image from local drive or insert image from URL ...
similarity:
popularity:
drawing
tools
design
online
graphics
web2.0
visualization
free
visio
web
|
 |
No information avaiable
similarity:
popularity:
visualization
design
infographics
information
data
blog
graphics
statistics
inspiration
illustration
|
|
|
No information avaiable
similarity:
popularity:
visualization
design
data
graphics
information
reference
resources
links
infographics
visualisation
|
|
|
Data visualizations can be gorgeous, but images often don't do them justice, especially if we're talking live, real-time visualizations (some of which require a
similarity:
popularity:
visualization
data
video
statistics
graphics
visualisation
inspiration
visualizations
technology
visual
|
 |
Some projects are maps, some are interactive, and some are applications. ... Putting public data in print - because it looks way better on paper. ...
similarity:
popularity:
visualization
statistics
data
design
infographics
maps
flowingdata
information
tools
visualisation
|
|
|
Pivot is our most ambitious project at Live Labs to date. It is an application designed to view and interact with massive amounts of data in ways that are powerful, ...
similarity:
popularity:
visualization
microsoft
data
pivot
research
software
tools
labs
ui
design
|
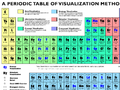 |
No information avaiable
similarity:
popularity:
visualization
design
diagrams
reference
charts
tools
concepts
presentation
graphics
data
|
Sorting Results
- This slider determines how the matched sites are sorted.
- If you want to see the most popular sites that are somewhat related to your search, slide this more towards "popularity."
- If you want to see the sites that best matched your search, regardless of popularity, slide this towards "similarity."
Must Include Tags
- Matched sites will not be shown unless they have all of the tags on this list.
- This feature is useful for when you require a site to have been tagged as something.
- To add a tag to this list, click "add tag" or click on any tag in a result.
Must Not Include Tags
- Matched sites that have any tag on this list will not be shown.
- This feature is useful for filtering out results that have tags you are absolutely not interested in.
- To add a tag to this list, click "add tag" or click on any tag in a result.
Types of Results
- This option lets you specify the types of sites to show.
- If you want to only see domains (www.
.com), select "domains only." - If you want to only see articles (www.
.com/something/here), select "articles only." - If you don't care, or care so much about both, select "Both".
About The Results
 an example search result
How moreofit Searches
Each website has a unique tag signature -- a set of words
that users have described the website as. Moreofit searches
for websites that have similar tag signatures and displays the results.
1: Similarity
A site's "similarity" is determined by how well its tag signature matches the tag
signature that is being searched for. A 100% match means that it has the exact same
tags in the exact same order, while a 0% match means it has no tags in common.
2: Popularity
The popularity of a website is, well, pretty much self explanatory.
3: Tag Signature
The tag signatures show how a site is described. The deeper the color of the tag,
the more frequently the website is tagged as this. Tags underlined blue denote a tag
that is in common with the search's tag signature.