▼
Advanced Options
?
Sort by:


popularity
similarity
?
Must Include:
?
Cannot Include:
?
Look For
▼
Sponsored Links
You're looking for other sites like :
 |
By country and continent, 1999-2009. From the OECD, June 2009. A word tree centered on "we" ... Economic Recession. Let's hope it's over soon. Sports. All ...
http://manyeyes.alphaworks.ibm.com/manyeyes/
popularity:
visualization
data
tools
statistics
web2.0
graphics
research
visualisation
design
software
|
new
search by a custom tag signature
 |
Within minutes, our free data visualization tool can help you create an interactive viz ... Anyone can do it, it's that easy—and it's free. learn more ...
similarity:
popularity:
visualization
data
tools
graphics
charts
infographics
design
free
software
analytics
|
 |
I am Chris Harrison, a doctoral student at Carnegie Mellon University's Human ... I then rendered a series of tree-ring-like visualizations (moving outwards in time) ...
similarity:
popularity:
visualization
design
visualisation
data
graphics
infographics
web2.0
technology
information
art
|
 |
Blog assessing and criticizing unclear, uninformative graphics of data, and recycling "chartjunk" as junk art.
similarity:
popularity:
visualization
statistics
charts
design
blog
graphics
information
blogs
infographics
data
|
 |
No information avaiable
similarity:
popularity:
visualization
software
tools
data
flash
statistics
web2.0
charts
bi
visualisation
|
 |
GGobi is a data visualization system for viewing high-dimensional data and is ... Learn how to use GGobi with the manual, the book, and the demo movies ...
similarity:
popularity:
visualization
statistics
software
graphics
data
r
opensource
datamining
tools
analysis
|
 |
No information avaiable
similarity:
popularity:
visualization
design
reference
information
data
graphs
tools
presentation
table
graphics
|
 |
Mycrocosm is a web site that makes it possible for people to use statistical graphs and other visual language tools for expressive social communication. In ...
similarity:
popularity:
visualization
statistics
data
tools
infographics
web2.0
social
stats
information
web
|
 |
Data visualisation tools from IBM. Site allows users to upload data and then produce graphic representations for others to view and comment upon.
similarity:
popularity:
data
visualization
tools
web2.0
graphics
visualisation
design
information
web
technology
|
 |
No information avaiable
similarity:
popularity:
visualization
data
tools
charts
javascript
chart
statistics
resources
design
flash
|
|
|
Our free weekly newsletter showcases all of ACM Queue's latest articles and ... Stay up to date on the latest developments at ACM Queue, including announcements ...
similarity:
popularity:
visualization
data
design
infographics
graphics
statistics
charts
reference
information
graph
|
Sorting Results
- This slider determines how the matched sites are sorted.
- If you want to see the most popular sites that are somewhat related to your search, slide this more towards "popularity."
- If you want to see the sites that best matched your search, regardless of popularity, slide this towards "similarity."
Must Include Tags
- Matched sites will not be shown unless they have all of the tags on this list.
- This feature is useful for when you require a site to have been tagged as something.
- To add a tag to this list, click "add tag" or click on any tag in a result.
Must Not Include Tags
- Matched sites that have any tag on this list will not be shown.
- This feature is useful for filtering out results that have tags you are absolutely not interested in.
- To add a tag to this list, click "add tag" or click on any tag in a result.
Types of Results
- This option lets you specify the types of sites to show.
- If you want to only see domains (www.
.com), select "domains only." - If you want to only see articles (www.
.com/something/here), select "articles only." - If you don't care, or care so much about both, select "Both".
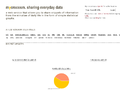
About The Results
 an example search result
How moreofit Searches
Each website has a unique tag signature -- a set of words
that users have described the website as. Moreofit searches
for websites that have similar tag signatures and displays the results.
1: Similarity
A site's "similarity" is determined by how well its tag signature matches the tag
signature that is being searched for. A 100% match means that it has the exact same
tags in the exact same order, while a 0% match means it has no tags in common.
2: Popularity
The popularity of a website is, well, pretty much self explanatory.
3: Tag Signature
The tag signatures show how a site is described. The deeper the color of the tag,
the more frequently the website is tagged as this. Tags underlined blue denote a tag
that is in common with the search's tag signature.