▼
Advanced Options
?
Sort by:


popularity
similarity
?
Must Include:
?
Cannot Include:
?
Look For
▼
Sponsored Links
You're looking for other sites like :
|
|
No information avaiable
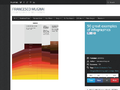
http://www.informationisbeautiful.net/leftvright_US.html
popularity:
politics
government
infographics
visualization
design
right
left
images
graphics
usa
|
new
search by a custom tag signature
|
|
No information avaiable
similarity:
popularity:
government
law
politics
visualization
infographic
congress
flowchart
infographics
design
usa
|
 |
Provides an easy interface into the connection between campaign finances and legislative bills and votes. Cross-reference U.S. congressional and California state legislators, campaign donations, sponsored bills, votes, political issues, and industries.
similarity:
popularity:
politics
government
money
activism
visualization
reference
database
tools
research
mashup
|
|
|
A visual guide to where your federal tax dollars go.
similarity:
popularity:
politics
government
taxes
visualization
budget
statistics
reference
art
money
usa
|
|
|
For every day Congress is in session, we "visualize" what lawmakers say by calculating their word frequency, giving you an at-a-glance view of which issues they ...
similarity:
popularity:
politics
government
visualization
congress
words
language
web2.0
statistics
reference
usa
|
|
|
Get information... Name or ZIP: Search. Districts: Enter a zip code, like 90210 or 02138. Politicians: Enter a name, like Pelosi or Ron Paul. Take action...
similarity:
popularity:
politics
government
visualization
transparency
activism
data
tools
socialsoftware
watchdog
usa
|
|
|
Sentence length and word incidence in George W. Bush's State of the Union Addresses. ... style.org is a service of 13pt, and is dedicated to the memory of Col. ...
similarity:
popularity:
design
visualization
information
graphics
politics
maps
art
data
statistics
infographics
|
|
|
source: New York Times, The Guardian, Fortune and others. See this ... Subscribe for more Web Feed Twitter. Powered by WordPress and awesome Thematic Theme ...
similarity:
popularity:
visualization
economics
politics
money
infographics
design
information
graph
data
business
|
|
|
If the world were a village of 100 people, how would the composition be? ... The numbers are turned into graphics to give another sense a touch – Look, this ...
similarity:
popularity:
design
visualization
statistics
graphics
world
posters
inspiration
politics
infographics
art
|
 |
http://blogof.francescomugnai.com/2009/04/50-great-examples-of-infographics / [...] Reply ... via http://blogof.francescomugnai.com/2009/04/50-great-examples-of ...
similarity:
popularity:
infographics
design
visualization
inspiration
graphics
information
data
typography
illustration
infographic
|
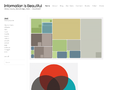 |
No information avaiable
similarity:
popularity:
visualization
design
infographics
information
data
blog
graphics
statistics
inspiration
illustration
|
Sorting Results
- This slider determines how the matched sites are sorted.
- If you want to see the most popular sites that are somewhat related to your search, slide this more towards "popularity."
- If you want to see the sites that best matched your search, regardless of popularity, slide this towards "similarity."
Must Include Tags
- Matched sites will not be shown unless they have all of the tags on this list.
- This feature is useful for when you require a site to have been tagged as something.
- To add a tag to this list, click "add tag" or click on any tag in a result.
Must Not Include Tags
- Matched sites that have any tag on this list will not be shown.
- This feature is useful for filtering out results that have tags you are absolutely not interested in.
- To add a tag to this list, click "add tag" or click on any tag in a result.
Types of Results
- This option lets you specify the types of sites to show.
- If you want to only see domains (www.
.com), select "domains only." - If you want to only see articles (www.
.com/something/here), select "articles only." - If you don't care, or care so much about both, select "Both".
About The Results
 an example search result
How moreofit Searches
Each website has a unique tag signature -- a set of words
that users have described the website as. Moreofit searches
for websites that have similar tag signatures and displays the results.
1: Similarity
A site's "similarity" is determined by how well its tag signature matches the tag
signature that is being searched for. A 100% match means that it has the exact same
tags in the exact same order, while a 0% match means it has no tags in common.
2: Popularity
The popularity of a website is, well, pretty much self explanatory.
3: Tag Signature
The tag signatures show how a site is described. The deeper the color of the tag,
the more frequently the website is tagged as this. Tags underlined blue denote a tag
that is in common with the search's tag signature.