▼
Advanced Options
?
Sort by:


popularity
similarity
?
Must Include:
?
Cannot Include:
?
Look For
▼
Sponsored Links
You're looking for other sites like :
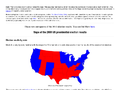 |
Book of cartograms: I have a new book of world cartograms entitled The Atlas of ... It's nothing to do with elections, but it contains more than 300 cartograms ...
http://www-personal.umich.edu/~mejn/election/2008/
popularity:
politics
maps
visualization
election
statistics
voting
map
usa
2008
cartogram
|
new
search by a custom tag signature
 |
Map maker software for creating fully customizable interactive flash maps. StatPlanet also comes with over 250 world development indicators which ...
similarity:
popularity:
maps
statistics
visualization
data
geography
interactive
map
software
socialstudies
mapping
|
|
|
Sentence length and word incidence in George W. Bush's State of the Union Addresses. ... style.org is a service of 13pt, and is dedicated to the memory of Col. ...
similarity:
popularity:
design
visualization
information
graphics
politics
maps
art
data
statistics
infographics
|
|
|
Blog sharing a wide array of eccentric, vintage, fake, and remarkable maps. ... Filed under: Uncategorized — strangemaps @ 12:57 am ...
similarity:
popularity:
maps
blog
geography
cartography
history
map
visualization
mapping
blogs
design
|
|
|
Infographics, Information Design, Data Visualization, Visual ... www.understandingusa.com/ FOR CLASS DISCUSSION. NYTimes map. Census Data. Black women and marriage rates ...
similarity:
popularity:
visualization
design
statistics
information
usa
reference
politics
data
infographics
culture
|
|
|
Official candidate site for Senator John McCain, who is running for the 2008 Republican Presidential nomination.
similarity:
popularity:
politics
mccain
election
republican
president
2008
presidential
campaign
elections
usa
|
|
|
Get in-depth tech news coverage from Wired and read about how it is shaping culture, education, entertainment, communications and technology.
similarity:
popularity:
visualization
maps
culture
infographics
data
humor
map
usa
wired
sins
|
|
|
A visual guide to where your federal tax dollars go.
similarity:
popularity:
politics
government
taxes
visualization
budget
statistics
reference
art
money
usa
|
|
|
UUorld (pronounced "world") provides an immersive mapping environment, high ... Great explanations are unfortunately scarce, but UUorld makes them easier to ...
similarity:
popularity:
visualization
maps
statistics
software
mapping
tools
data
gis
geography
world
|
 |
This map shows MPs' expenses for April 2007 to March 2008 taken from the data ... This is a map showing data from an online survey of people's reaction to the ...
similarity:
popularity:
maps
visualization
mashup
mapping
web2.0
geography
map
data
tools
statistics
|
|
|
No information avaiable
similarity:
popularity:
maps
history
cartography
geography
politics
design
mapping
map
visualization
data
|
Sorting Results
- This slider determines how the matched sites are sorted.
- If you want to see the most popular sites that are somewhat related to your search, slide this more towards "popularity."
- If you want to see the sites that best matched your search, regardless of popularity, slide this towards "similarity."
Must Include Tags
- Matched sites will not be shown unless they have all of the tags on this list.
- This feature is useful for when you require a site to have been tagged as something.
- To add a tag to this list, click "add tag" or click on any tag in a result.
Must Not Include Tags
- Matched sites that have any tag on this list will not be shown.
- This feature is useful for filtering out results that have tags you are absolutely not interested in.
- To add a tag to this list, click "add tag" or click on any tag in a result.
Types of Results
- This option lets you specify the types of sites to show.
- If you want to only see domains (www.
.com), select "domains only." - If you want to only see articles (www.
.com/something/here), select "articles only." - If you don't care, or care so much about both, select "Both".
About The Results
 an example search result
How moreofit Searches
Each website has a unique tag signature -- a set of words
that users have described the website as. Moreofit searches
for websites that have similar tag signatures and displays the results.
1: Similarity
A site's "similarity" is determined by how well its tag signature matches the tag
signature that is being searched for. A 100% match means that it has the exact same
tags in the exact same order, while a 0% match means it has no tags in common.
2: Popularity
The popularity of a website is, well, pretty much self explanatory.
3: Tag Signature
The tag signatures show how a site is described. The deeper the color of the tag,
the more frequently the website is tagged as this. Tags underlined blue denote a tag
that is in common with the search's tag signature.