▼
Advanced Options
?
Sort by:


popularity
similarity
?
Must Include:
?
Cannot Include:
?
Look For
▼
Sponsored Links
You're looking for other sites like :
|
|
No information avaiable
http://www.bissantz.de/sparklines/
popularity:
sparklines
visualization
tufte
design
graphics
software
excel
fonts
data
tools
|
new
search by a custom tag signature
|
|
Adventures in visual thinking: The Back of the Napkin blog ... Learning from Japanese school children (amazing) The Credit Crisis ... on the back of a napkin ...
similarity:
popularity:
visualization
blog
design
visualthinking
graphics
innovation
blogs
creativity
visual
napkin
|
 |
Inkscape is a Vector Graphics Editor, similar to Adobe Illustrator, that strives to be SVG Compliant, open source, responsive and extensible.
similarity:
popularity:
software
graphics
opensource
vector
svg
design
freeware
tools
free
linux
|
|
|
No information avaiable
similarity:
popularity:
visualization
design
data
inspiration
information
data-visualization
graphics
maps
ui
reference
|
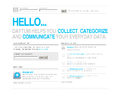 |
Daytum is a home for collecting and communicating your daily data. ... JUNE 27, 2009: DAYTUM BECOMES MORE FLEXIBLE THAN EVER; GROUP THE ITEMS YOU TRACK ...
similarity:
popularity:
visualization
data
statistics
tracking
infographics
design
web2.0
tools
stats
inspiration
|
|
|
We suggest that this type of complex layered graph is effective for displaying ... We provide a mathematical analysis of how this layered graph relates to ...
similarity:
popularity:
visualization
statistics
design
streamgraph
graphics
data
graph
paper
charts
research
|
 |
Archive of freely downloadable fonts. Browse by alphabetical listing, by style, by author or by popularity.
similarity:
popularity:
fonts
free
typography
design
font
download
webdesign
resources
graphics
tools
|
 |
ParaView is an open-source, multi-platform application designed to visualize data sets of size varying from small to very large.
similarity:
popularity:
visualization
software
opensource
3d
science
graphics
tools
data
analysis
visualisation
|
|
|
Nathan from FlowingData just blogged about a post I missed a couple weeks back ... Serendipitously, this was the central topic of my Comparative Media Studies ...
similarity:
popularity:
visualization
design
blog
information
research
infovis
visualisation
data
graphics
tools
|
|
|
Colorbrewer 2.0 is an online tool designed to help people select good color schemes for maps and other graphics.
similarity:
popularity:
color
maps
visualization
design
tools
gis
graphics
mapping
colour
data
|
 |
Free, online bitmap-to-vector conversion tool that improves picture quality by eliminating the pixelization that occurs in bitmap images.
similarity:
popularity:
vector
graphics
tools
converter
design
software
art
free
generator
photography
|
Sorting Results
- This slider determines how the matched sites are sorted.
- If you want to see the most popular sites that are somewhat related to your search, slide this more towards "popularity."
- If you want to see the sites that best matched your search, regardless of popularity, slide this towards "similarity."
Must Include Tags
- Matched sites will not be shown unless they have all of the tags on this list.
- This feature is useful for when you require a site to have been tagged as something.
- To add a tag to this list, click "add tag" or click on any tag in a result.
Must Not Include Tags
- Matched sites that have any tag on this list will not be shown.
- This feature is useful for filtering out results that have tags you are absolutely not interested in.
- To add a tag to this list, click "add tag" or click on any tag in a result.
Types of Results
- This option lets you specify the types of sites to show.
- If you want to only see domains (www.
.com), select "domains only." - If you want to only see articles (www.
.com/something/here), select "articles only." - If you don't care, or care so much about both, select "Both".
About The Results
 an example search result
How moreofit Searches
Each website has a unique tag signature -- a set of words
that users have described the website as. Moreofit searches
for websites that have similar tag signatures and displays the results.
1: Similarity
A site's "similarity" is determined by how well its tag signature matches the tag
signature that is being searched for. A 100% match means that it has the exact same
tags in the exact same order, while a 0% match means it has no tags in common.
2: Popularity
The popularity of a website is, well, pretty much self explanatory.
3: Tag Signature
The tag signatures show how a site is described. The deeper the color of the tag,
the more frequently the website is tagged as this. Tags underlined blue denote a tag
that is in common with the search's tag signature.