▼
Advanced Options
?
Sort by:


popularity
similarity
?
Must Include:
?
Cannot Include:
?
Look For
▼
Sponsored Links
You're looking for other sites like :
 |
No information avaiable
http://www.insideria.com/2009/12/28-rich-data-visualization-too.html
popularity:
visualization
data
tools
charts
javascript
chart
statistics
resources
design
flash
|
new
search by a custom tag signature
|
|
Tired of red/yellow/green or up/down arrows for indicators? ... in Real Time | VizWorld.com: [...] National Debt Clock : Real Time via ChartPorn. ...
similarity:
popularity:
visualization
infographics
design
charts
data
blog
graphics
maps
statistics
blogs
|
|
|
Protovis composes custom views of data with simple marks such as bars and dots. ... Protovis is free and open-source, provided under the BSD License. It ...
similarity:
popularity:
javascript
visualization
charts
library
programming
graphs
graph
canvas
graphics
chart
|
|
|
We suggest that this type of complex layered graph is effective for displaying ... We provide a mathematical analysis of how this layered graph relates to ...
similarity:
popularity:
visualization
statistics
design
streamgraph
graphics
data
graph
paper
charts
research
|
|
|
No information avaiable
similarity:
popularity:
visualization
google
statistics
data
charts
tools
graph
analysis
gapminder
web2.0
|
 |
A website about visualization, art, visual thinking, aesthetics, and the connections between them. ... Two Years of EagerEyes. Market Meltdown in Living Color ...
similarity:
popularity:
visualization
blog
design
information
data
infovis
graphics
charts
art
statistics
|
 |
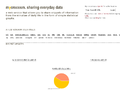
Daytum is a home for collecting and communicating your daily data. ... Daytum is free to use for as long as you like, but we also offer a Daytum Plus account ...
similarity:
popularity:
statistics
data
tracking
visualization
design
tools
chart
applications
inspiration
infographics
|
 |
Mycrocosm is a web site that makes it possible for people to use statistical graphs and other visual language tools for expressive social communication. In ...
similarity:
popularity:
visualization
statistics
data
tools
infographics
web2.0
social
stats
information
web
|
 |
Please enable JavaScript to use Data360.org. Please follow the steps below to enable JavaScript. First determine what browser version is in use: ...
similarity:
popularity:
data
visualization
statistics
web2.0
research
reference
graphics
graph
social
tools
|
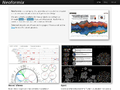 |
... that you keep the reference to http://neoformix.com and that you send me an email ... Older Posts... Copyright © 2006-2009 Neoformix. online web counter ...
similarity:
popularity:
visualization
data
statistics
blog
design
datamining
information
graphics
twitter
web2.0
|
|
|
Some of these have been written by Google, and some have been written by third parties. ... ( Links to third-party visualizations will take you off the Google site. ...
similarity:
popularity:
google
visualization
api
javascript
charts
tools
programming
webdesign
data
graphs
|
Sorting Results
- This slider determines how the matched sites are sorted.
- If you want to see the most popular sites that are somewhat related to your search, slide this more towards "popularity."
- If you want to see the sites that best matched your search, regardless of popularity, slide this towards "similarity."
Must Include Tags
- Matched sites will not be shown unless they have all of the tags on this list.
- This feature is useful for when you require a site to have been tagged as something.
- To add a tag to this list, click "add tag" or click on any tag in a result.
Must Not Include Tags
- Matched sites that have any tag on this list will not be shown.
- This feature is useful for filtering out results that have tags you are absolutely not interested in.
- To add a tag to this list, click "add tag" or click on any tag in a result.
Types of Results
- This option lets you specify the types of sites to show.
- If you want to only see domains (www.
.com), select "domains only." - If you want to only see articles (www.
.com/something/here), select "articles only." - If you don't care, or care so much about both, select "Both".
About The Results
 an example search result
How moreofit Searches
Each website has a unique tag signature -- a set of words
that users have described the website as. Moreofit searches
for websites that have similar tag signatures and displays the results.
1: Similarity
A site's "similarity" is determined by how well its tag signature matches the tag
signature that is being searched for. A 100% match means that it has the exact same
tags in the exact same order, while a 0% match means it has no tags in common.
2: Popularity
The popularity of a website is, well, pretty much self explanatory.
3: Tag Signature
The tag signatures show how a site is described. The deeper the color of the tag,
the more frequently the website is tagged as this. Tags underlined blue denote a tag
that is in common with the search's tag signature.