▼
Advanced Options
?
Sort by:


popularity
similarity
?
Must Include:
?
Cannot Include:
?
Look For
▼
Sponsored Links
You're looking for other sites like Ibm Alphaworks Manyeyes:
 |
Data visualisation tools from IBM. Site allows users to upload data and then produce graphic representations for others to view and comment upon.
http://manyeyes.alphaworks.ibm.com/
popularity:
data
visualization
tools
web2.0
graphics
visualisation
design
information
web
technology
|
new
search by a custom tag signature
|
|
Information about books and seminars as well as artwork for sale. Moderated forum answers questions about information design.
similarity:
popularity:
design
visualization
graphics
information
usability
art
books
graphic
tufte
data
|
 |
so_many_a_second is a visualizer that shows mondial statistics on a human scale. ... The great artworks of Chris Jordan have been an initial inspiration ...
similarity:
popularity:
visualization
statistics
design
information
flash
social
visualisation
data
inspiration
world
|
|
|
It made me think quite a bit, and might also help some to understand ... bit better, so here is the gist of the story (the following section mostly ...
similarity:
popularity:
visualization
blog
design
interface
information
data
research
tagging
infographics
usability
|
|
|
DataMasher helps citizens have a little fun with government and other public data by creating mashups to see how states compare on important issues. Users can create ...
similarity:
popularity:
data
visualization
statistics
mashup
government
tools
database
mashups
web2.0
maps
|
 |
I've posted about a number of the infographics from the GOOD Magazine ... Posted by Randy Krum at 6:02 AM 2 thoughts Links to this post ...
similarity:
popularity:
infographics
visualization
design
blog
graphics
information
inspiration
charts
reference
data
|
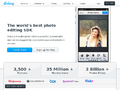 |
Aviary is the online leader in web based image editing software. ...
similarity:
popularity:
tools
design
photoshop
graphics
web2.0
software
online
webdesign
webapp
editor
|
|
|
No information avaiable
similarity:
popularity:
visualization
data
design
interaction
infographic
datavisualization
visualisation
information
copenhagen
interactiondesign
|
 |
Lovely Charts is an online diagramming application that allows you to create professional looking diagrams, such as flowcharts, sitemaps, organisation charts, ...
similarity:
popularity:
tools
charts
diagram
visualization
web2.0
chart
online
software
design
free
|
|
|
Blog covering infographics, data visualization and visual thinking
similarity:
popularity:
infographics
visualization
design
inspiration
graphics
blog
information
graphic
data
infographic
|
|
|
Colorbrewer 2.0 is an online tool designed to help people select good color schemes for maps and other graphics.
similarity:
popularity:
color
maps
visualization
design
tools
gis
graphics
mapping
colour
data
|
Sorting Results
- This slider determines how the matched sites are sorted.
- If you want to see the most popular sites that are somewhat related to your search, slide this more towards "popularity."
- If you want to see the sites that best matched your search, regardless of popularity, slide this towards "similarity."
Must Include Tags
- Matched sites will not be shown unless they have all of the tags on this list.
- This feature is useful for when you require a site to have been tagged as something.
- To add a tag to this list, click "add tag" or click on any tag in a result.
Must Not Include Tags
- Matched sites that have any tag on this list will not be shown.
- This feature is useful for filtering out results that have tags you are absolutely not interested in.
- To add a tag to this list, click "add tag" or click on any tag in a result.
Types of Results
- This option lets you specify the types of sites to show.
- If you want to only see domains (www.
.com), select "domains only." - If you want to only see articles (www.
.com/something/here), select "articles only." - If you don't care, or care so much about both, select "Both".
About The Results
 an example search result
How moreofit Searches
Each website has a unique tag signature -- a set of words
that users have described the website as. Moreofit searches
for websites that have similar tag signatures and displays the results.
1: Similarity
A site's "similarity" is determined by how well its tag signature matches the tag
signature that is being searched for. A 100% match means that it has the exact same
tags in the exact same order, while a 0% match means it has no tags in common.
2: Popularity
The popularity of a website is, well, pretty much self explanatory.
3: Tag Signature
The tag signatures show how a site is described. The deeper the color of the tag,
the more frequently the website is tagged as this. Tags underlined blue denote a tag
that is in common with the search's tag signature.